
Neil A. Hamlett, D.Sc., MBA
2651 Park Tower Drive ⋄ Vienna, VA, 22180 ⋄ (703)261-9310 ⋄ neil.hamlett@uncertainty-research.science
Data Science ⋄ Business Analysis ⋄ Systems Engineering
Data Science ⋄ Business Analysis ⋄ Systems Engineering
I fuse PhD quant skills with an MBA business-consultant's toolkit. Turning innovative technology into differentiating operational models has been the hallmark of my career. Combining eyes-wide-open perspective about technologies' opportunities and weaknesses with a laser-like focus on the business priorities is the key.
As a data scientist, I've worked in product-development and consulting roles. I've written complex logic in R, python, SQL, and Scala. I've also shaped strategic directions for complex projects and systems based on quantitative methods beyond data science. I've been both a buyer and developer of complex systems.
Publication. Ⓐ This work is submitted for presentation at the 2020 Annual Meeting for the Institute for Operations Research and Management Science. May 15 Update: ⓵ The proposed abstract appears here. ⓶ This is the submission receipt. Ⓑ The novel approach taking shape may be a candidate for the 2021 Conference on Uncertiainty in Artificial Intelligence.
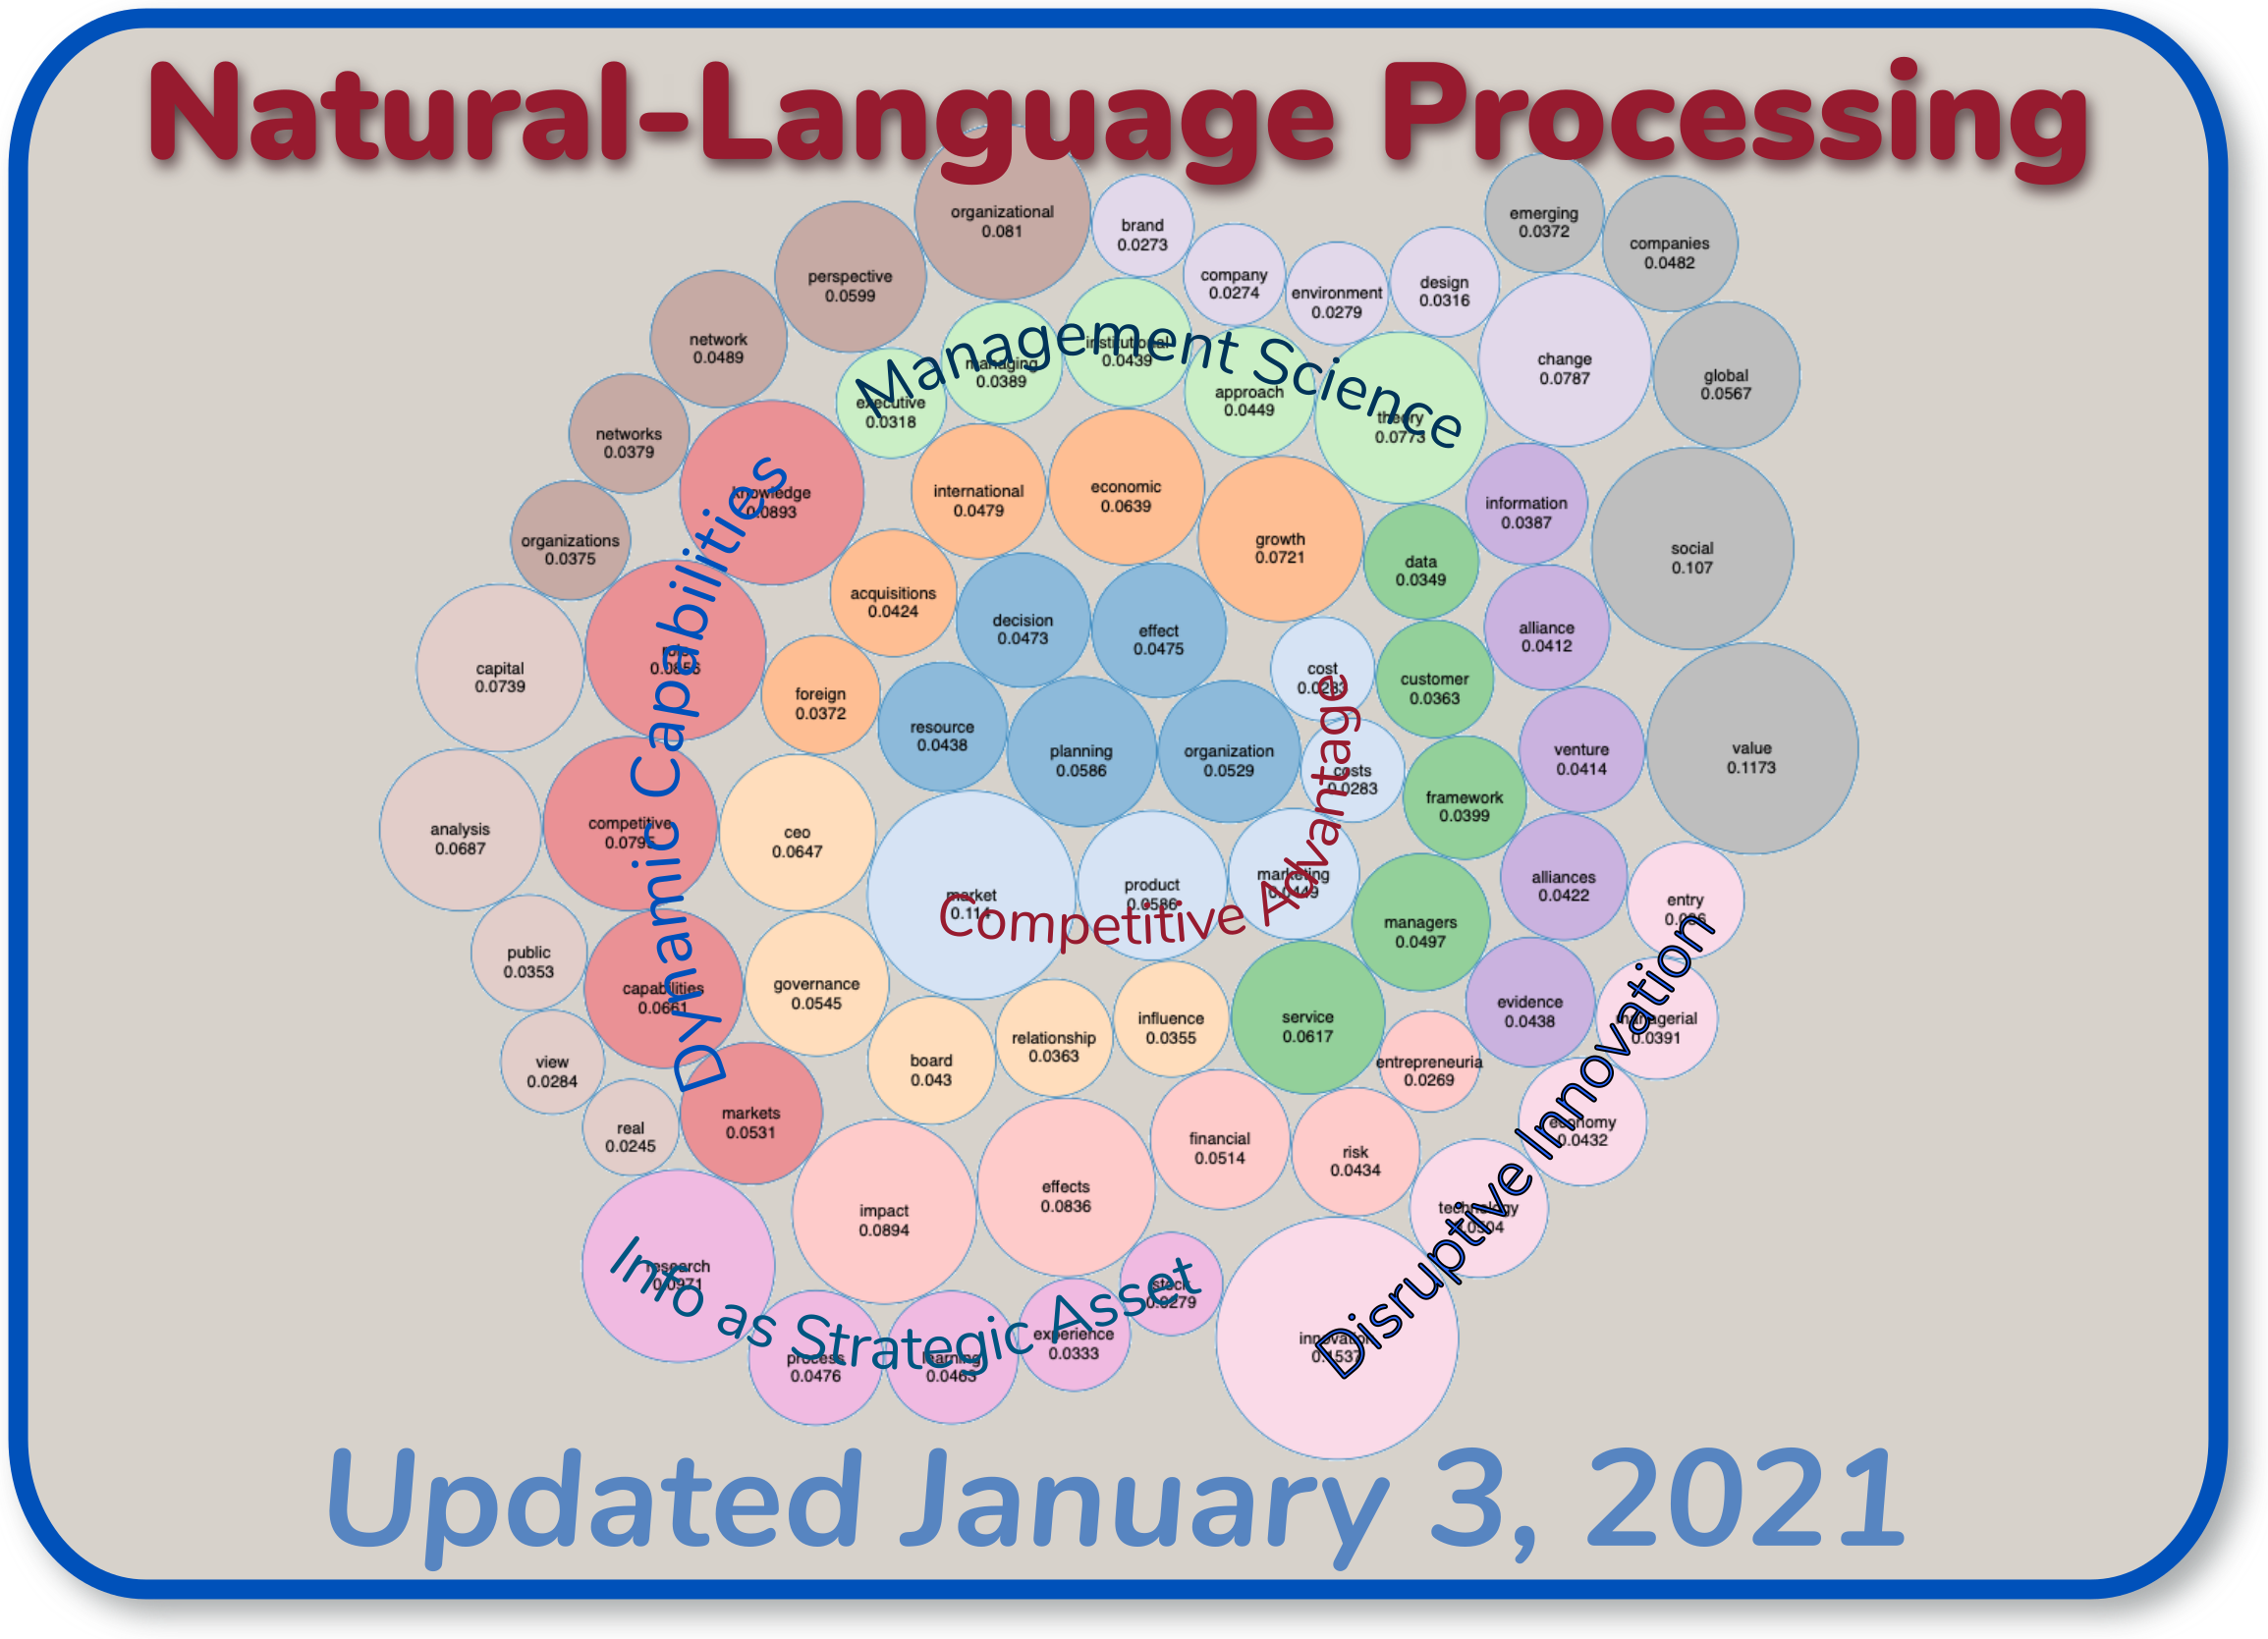
Managerial summary. This project performs a Natural-Language-Programming (NLP) topic analysis of business-strategy literature. Articles were collected from eight journals spanning the 1980 - 2020 timeframe. Titles and abstracts from nearly 6,000 articles were collected in all. We group articles according to topics, which the algorithm itself selects. We find article groupings that correspond to each of five distinct themes in business strategy.
Technical summary. A Latent Dirichlet Allocation (LDA) analysis estimates how documents and terms are associated with thematic topics. The corpus consists of ≲ 6,000 titles and abstracts from eight published journals, with publication dates beginning in 1980. Data collection is performed using python. Databricks Community Edition provides the Spark Scala runtime environment for statistical computation. Unprecedented entropy-based methods were applied to quantify the goodness-of-fit for the latent clusters that were identified.
Publication. An abstract based on this work was accepted for presentation to the 2019 Special Conference on Classroom Assessment by the National Council on Measurements in Education (NCME). The paper was withdrawn when the IBM product on which it was based was discontinued.
Managerial summary. IBM attempted to expand its footprint into the education-technology market during the period 2014 - 2019. Its Watson Classroom cloud-based platform offering sought to help personalize learning for each individual student. At its peak, more than a dozen U.S. school districts nationwide were in various stages of adoption. The initiative was discontinued in 2019.
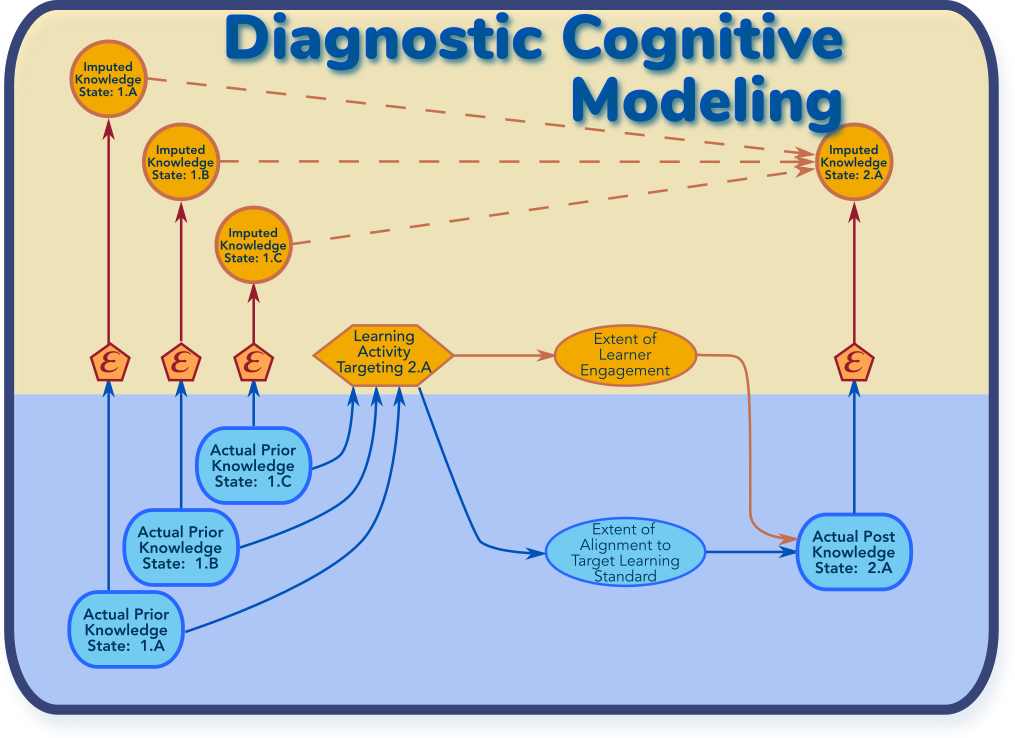
The core Watson-Classroom offering delivered three high-level capabilities. First, it aspired to provide a "one-stop portal" by which classroom teachers and administrators could see essential information about each student. This included attendence and academic progress. Second, a diagnostic cognitive model triangulated each student's strengths and weaknesses with respect to prerequsite learning objectives. This feature was marketed as Mastery. Finally, a content-recommendation system used natural-language processing to identify supplementary teaching materials targeting specific diagnosed weaknesses.
Watson Classroom was primarily marketed in terms of its key user-interface applications. Enlight was a web-based application that allowed teachers to do detailes work of analyzing individual student's readiness for the next lesson and planning review of weak prerequisites. The Element application was hosted on an iPad. Teachers would quickly record observations as they romed around the classroom, interacting with students.

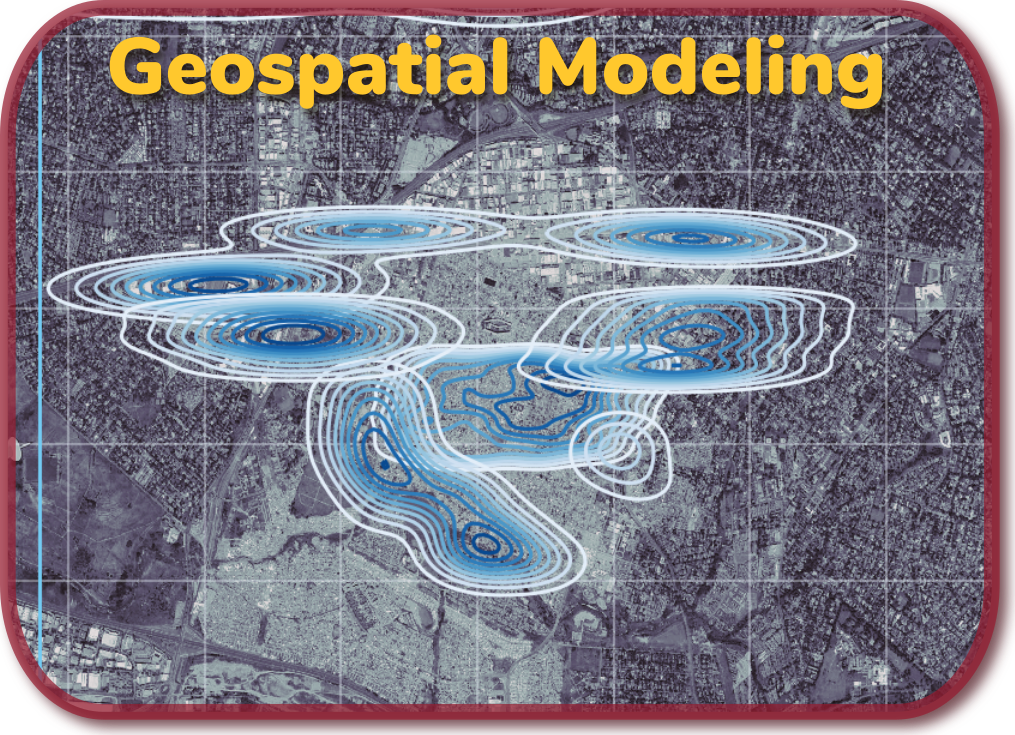
Managerial summary. Imagery-processing techniques are combined with machine learning to detect informal settlements in a developing-world metropolitan area. This work was performed for nonprofit New Light Technologies (NLT). NLT seeks to find better ways to help the delivery of aid by other nonprofits. Focusing the Johannesburg, SA region, this work provides a preliminary demonstration of the feasibility detecting informal settlements (aka "slums") using overhead imagery and Population-density maps provided by Facebook. The approach effectively distinguishes the Alexandra, Gauteng region from outlying areas.
Technical summary. We apply unsupervised-learning methods in an attempt to discriminate informal-settlement (aka "slum") areas in major population centers. The method should be applicable to emerging-economy regions lacking information and commercial infrastructure taken for-granted in developed economies. A general, automated-classification system seems ambitous right now, considering wide geographical variations. We begin with the assumption that discrimination is practical on metropolitan, regional scales.
That informal settlements will be visibly distinct provides our working hypothesis. Residential construction in slums is often ad-hoc, and not professional-grade. Foilage is an unaffordable luxury for residents. These and other factors lead to visible distinctions that are exploitable using judiciously-selected image-processing methds. Statistical- (⊃machine-)learning methods can be applied to products of such imagery-prrocessing to discriminate between "slum" and "non-slum" areas.
Data from two geospatial sources are fused. Population-density maps provided by Facebook are overlaid onto georeferenced data from Google Maps. A Discrete Wavelet Transform is applied to the imagery itself. A clustering machine-learning algorithm processes the population-density estimates, the latitude and longitude of those estimates, and the DWT-transformed imagery to identify likely clusters.
The use of DWT preprocessing of imagery for machine learning appears novel. DWT resembles the filtering and pooling stages used in convolutional neural networks. DWTs appear to have an advantage in distinguishing different textures in overhead-imagery surface terrain. Many also satisfy the perfect-reconstruction property, meaning that the original image can be reconstructed from the transform. This has profound consequences for model-explainability and -interpretability.
The Alexandra, Gauteng region, a well-known slum, is particularly prominent. The DWT seems to be distinguishing the texture of this area from that of the rest of the city. The clustering can likelihood be improved through scalaing of the latitude-longitude features to get more-localized clusters. Improving the imagery resolution might also help. Structure from the original image appears to remain after the final stage of DWT composition achievable at the resolution used here. This means that more information can be extracted.
Publication. This contains candidate content for perhaps three conferences during Calendary Year 2021. The as-yet-unannounced Institute for Operations Research and Management Science (INFORMS) "2021 Advances in Decision Analysis" conference is the first opportunity. The Decision-Analysis Affinity Group 2021 conference by the Society of Decision Professionals (SDP) is the second. An as-yet-unannounced "2021 Games and Decisions in Risk and Reliability" (GDRR) conference by the International Society for Bayesian Analysis (ISBA) is the third. This work's principal contribution illustrates connections between data science and decsision analysis. Such linkages are of interest both to SDP and to the (INFORMS) Decision Analysis Society.
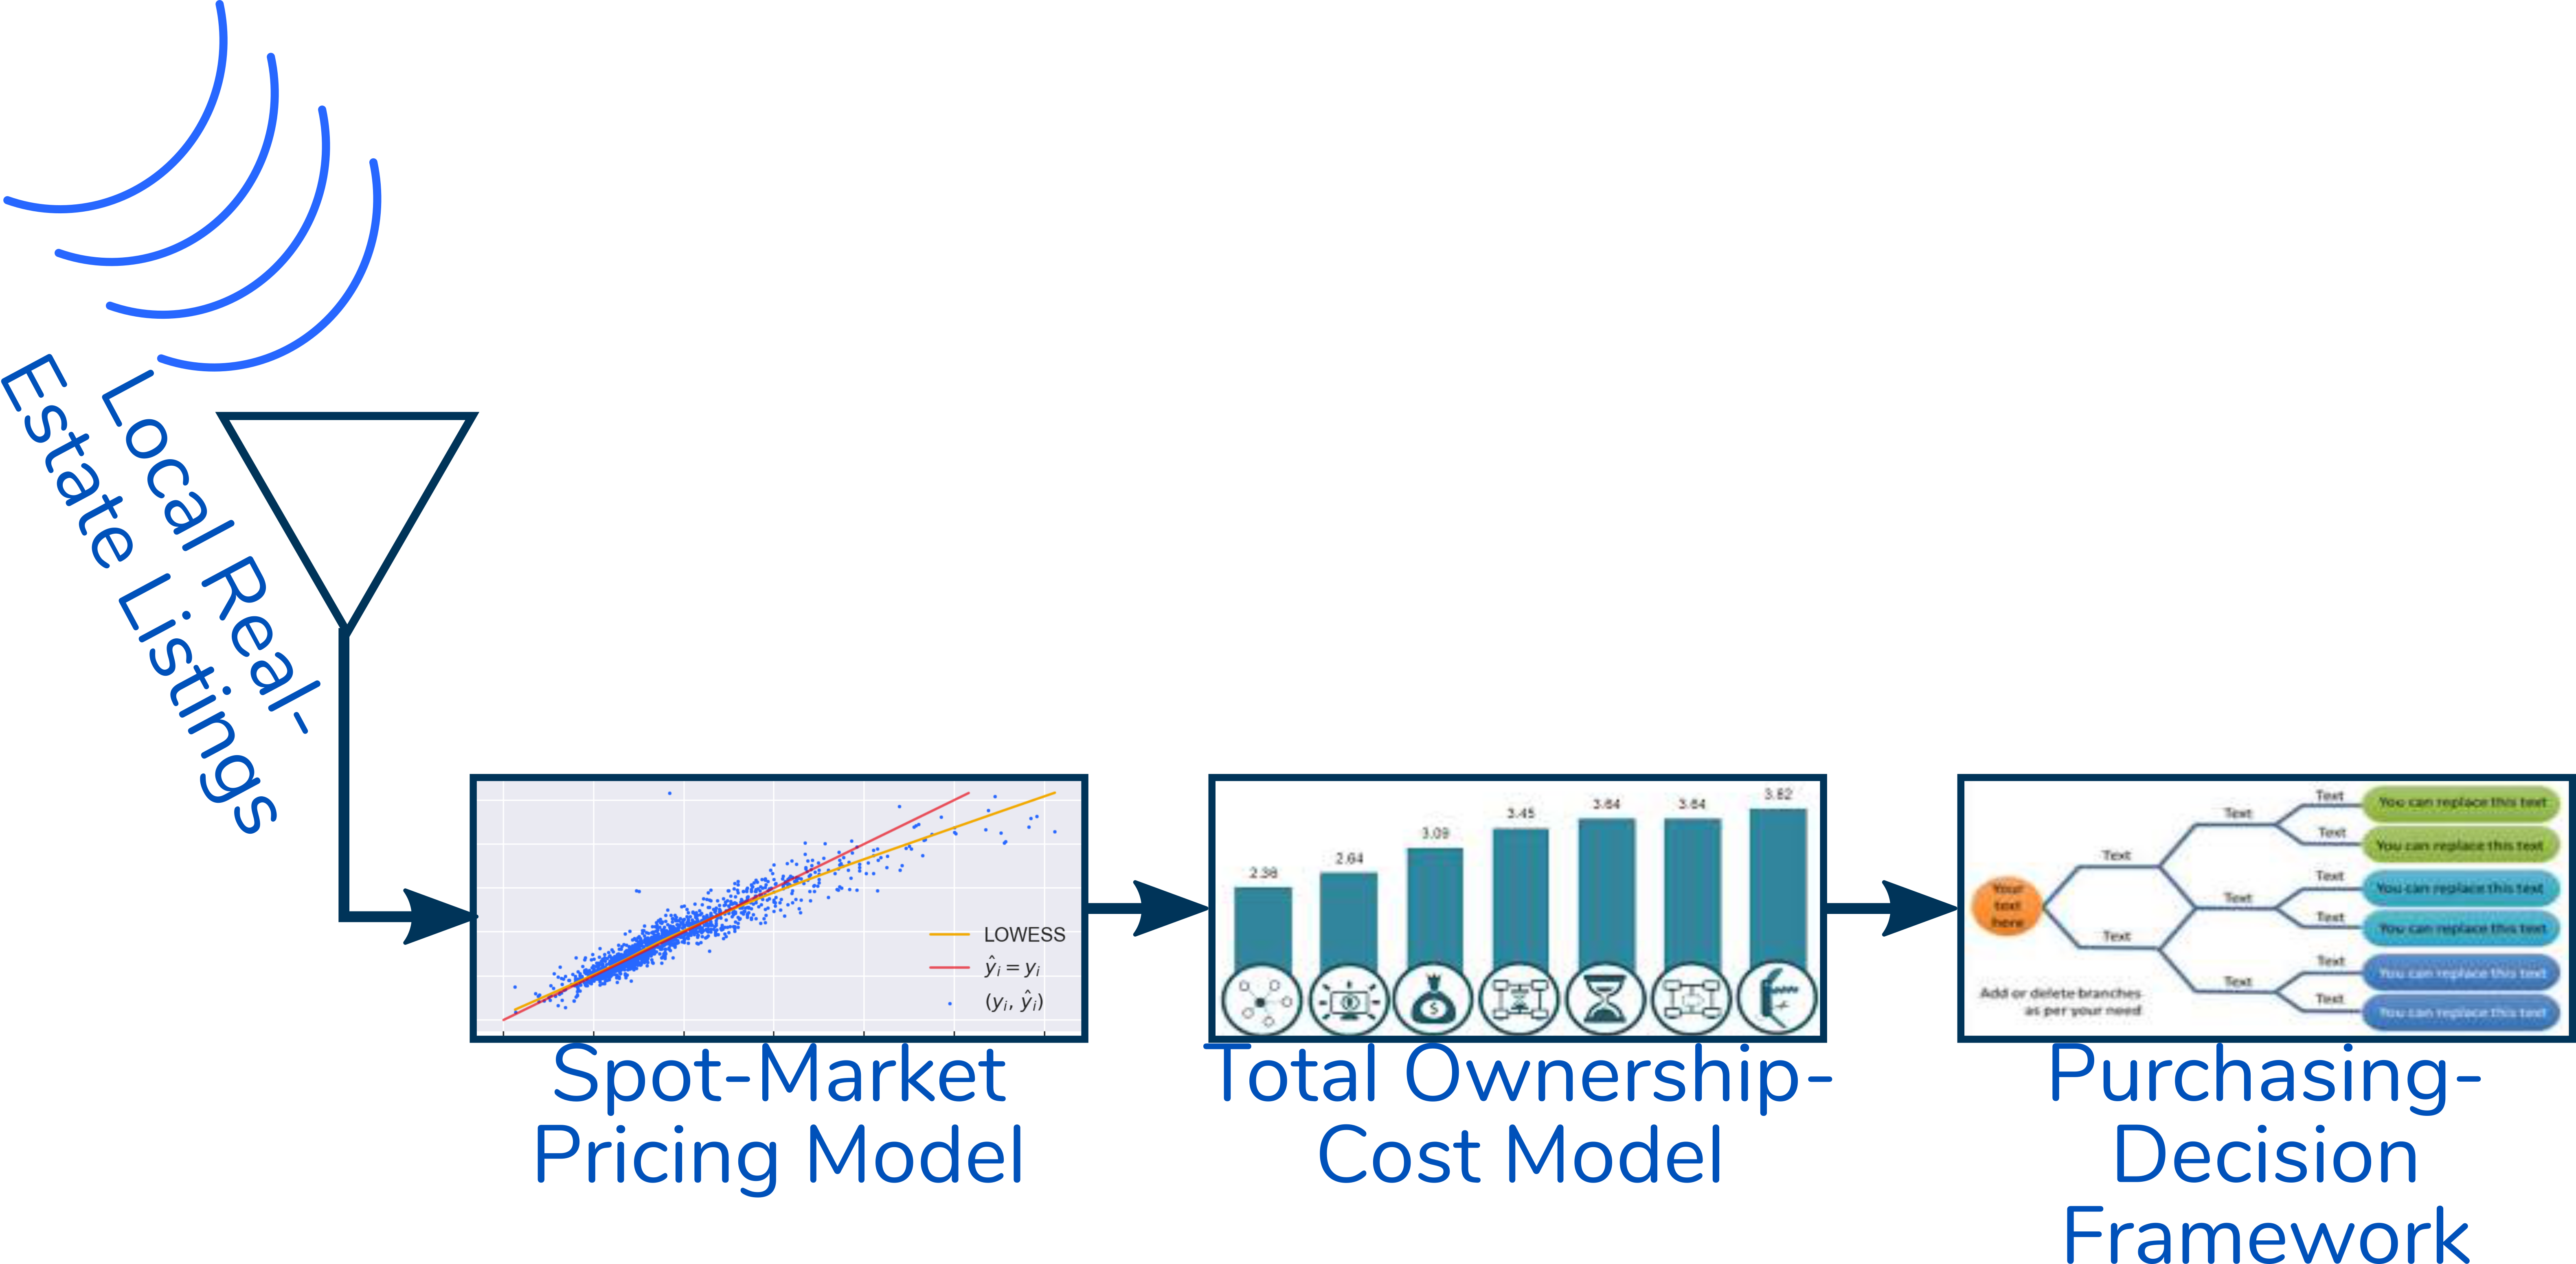
Managerial summary. An hypothetical Real Estate Investment Trust (REIT) seeks to enter the residential real-estate rental market. This emerging business model is described in [R. Dizember, L. Kuzisto, WSJ, July 21, 2017], [A. Semuels, The Atlantic, February 13, 2019], and elsewhere. This work sketches out an operational concept with very high-level solution architecture. A predictive-model component is prototyped.
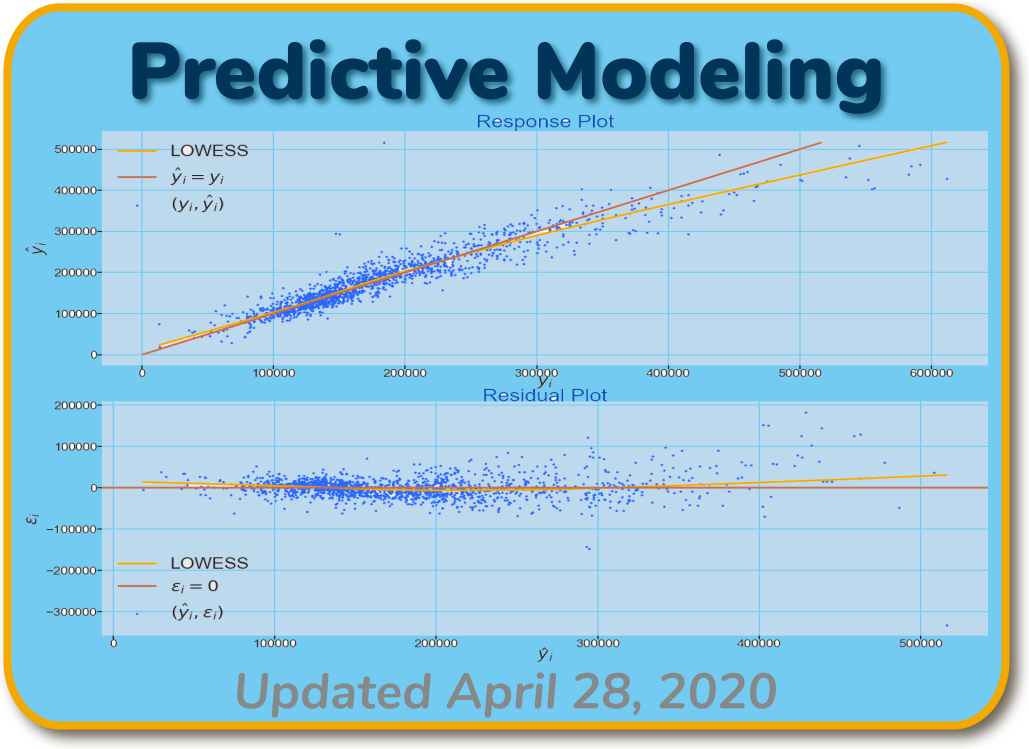
The figure below illustrates the operational concept. An automated decision-support solution provides REIT representatives with purchasing authority with recommendations on properties that might be purchased under favorable terms. The emphasis here is on the Spot-Market Pricing Model component. We prototype this element of the solution. Data from well-known Kaggle challenge serve to explore the concept.
Exercising a variety of machine-learning methods, we demonstrate the likely achievable performance of the pricing model. Specifically, we demonstrate models that explain around 85% of the variation in housing prices in the market we study. The estimation error is driven by a small number of outliers. The models also tend to slightly underestimate the prices of properties in the upper end of the market.
Subsequent work will refine the pricing model and build out prototypes for other solution segments. We describe here the principles on which they are designed. The path forward is based on well-established principles in decision and financial analysis.
Technical summary A variety of machine-learning methods are applied to a predictive model of housing prices. A well-known Kaggle challenge provides the data set. Seventy-seven explanatory variables are applied to the various approaches. These were selected based on their degree of influence on the target variable, housing sales price.
Tree-based ensemble methods provide the best results. Specifically, bagging trees [Hastie, et al, §8.7] and random forests [Hastie, et al, chap 15] provide the best predictive performance. The models are nearly optimally fit with coefficients of determination for both training and test data. An Ada-Boosted Regression Tree approach [Hastie, et al, chap 10] provides only marginally weaker
, but near-optium fitting. A logistic-regression model [Hastie, et al, §4.4] provides good fit to the training data, but suffers from a small degree of overfitting.
Subsequent work will refine the predictive model. Distributions — in addition to point estimates produced here — of house-price estimates will be produced. These are required to support subsequent decision analysis. Additionally, the decision modeling and ownership-cost modeling themselves will be developed.
Publication. This is a draft of a journal article looking for a home. Strategy Science of the Institute for Operations Research and Management Science originally declined this paper. Numerous alternative candidates were discoverd during the business-strategy topic-analysis study.
Managerial summary. Organizations look to capitalize on rapidly-emerging data technologies to keep up or generate competitive advantage. Data Science and Machine Learning are prominent among these technologies. They provide organization with information that was not previously available. It turns out that information itself — whether produced by Artifical Intelligence (AI), machine learning, data science or not — is the key source of differentiation. This work provides a framework for thinking about how to focus data-initiatives in order to create well-thought-out positions of competitive advantage.
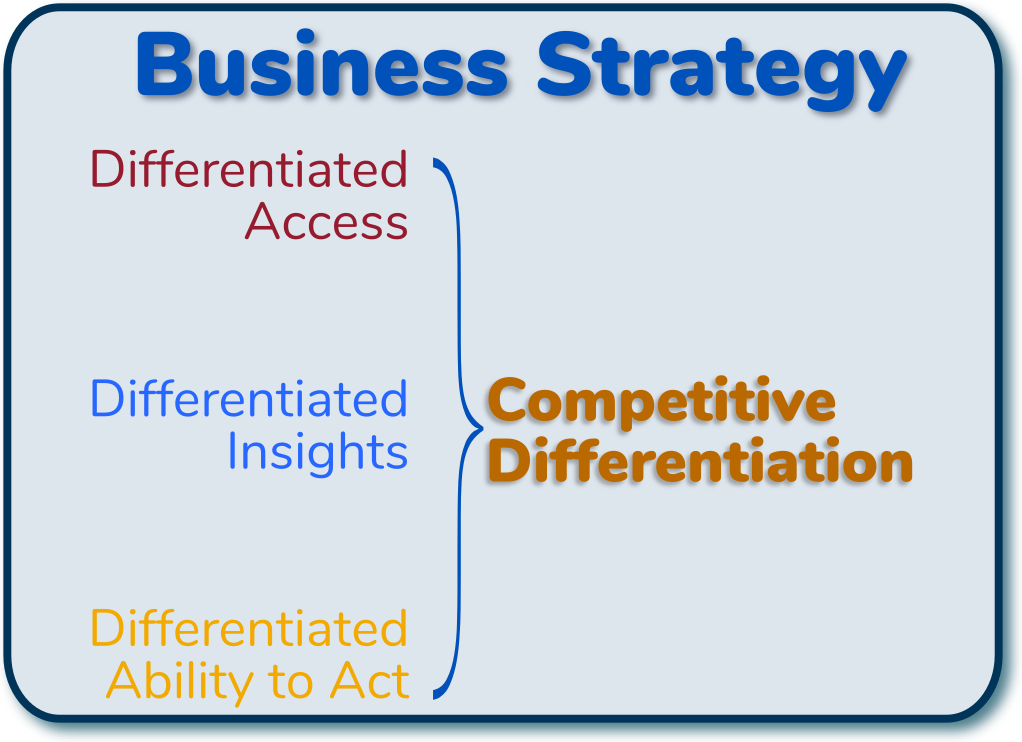
Technical summary (Article abstract). Principles from Information Economics provide a foundation for a framework by which to systematically characterize competitive advantage based on information. This framework leads to three distinct modes of differentiation. Differentiated access delivers advantage based on information others lack. Differentiated insights confer the upper hand to those deriving knowledge that others miss from a commonly-available information base. And organizations with differentiated ability to act exploit common knowledge more-effectively than competitors. Often occurring in combinations, these modes vary in their degrees of defensibility. The differentiated-insights mode is most-easily replicated. Often going together, differentiated access and differentiated ability to act can confer comparatively more-formidable barriers to replication. Following P Drucker’s recommendation of thinking about knowledge — information’s derivative — as a decisive strategic asset leads to consideration of approaches to organizing around its curation and exploitation.
Publication. This paper was presented to the 2019 Advances in Decision Analysis conference organized by the Decision-Analysis Society of the Institute for Operations Research and Management Science (INFORMS). An update was presented at the 2019 INFORMS Annual Meeting.
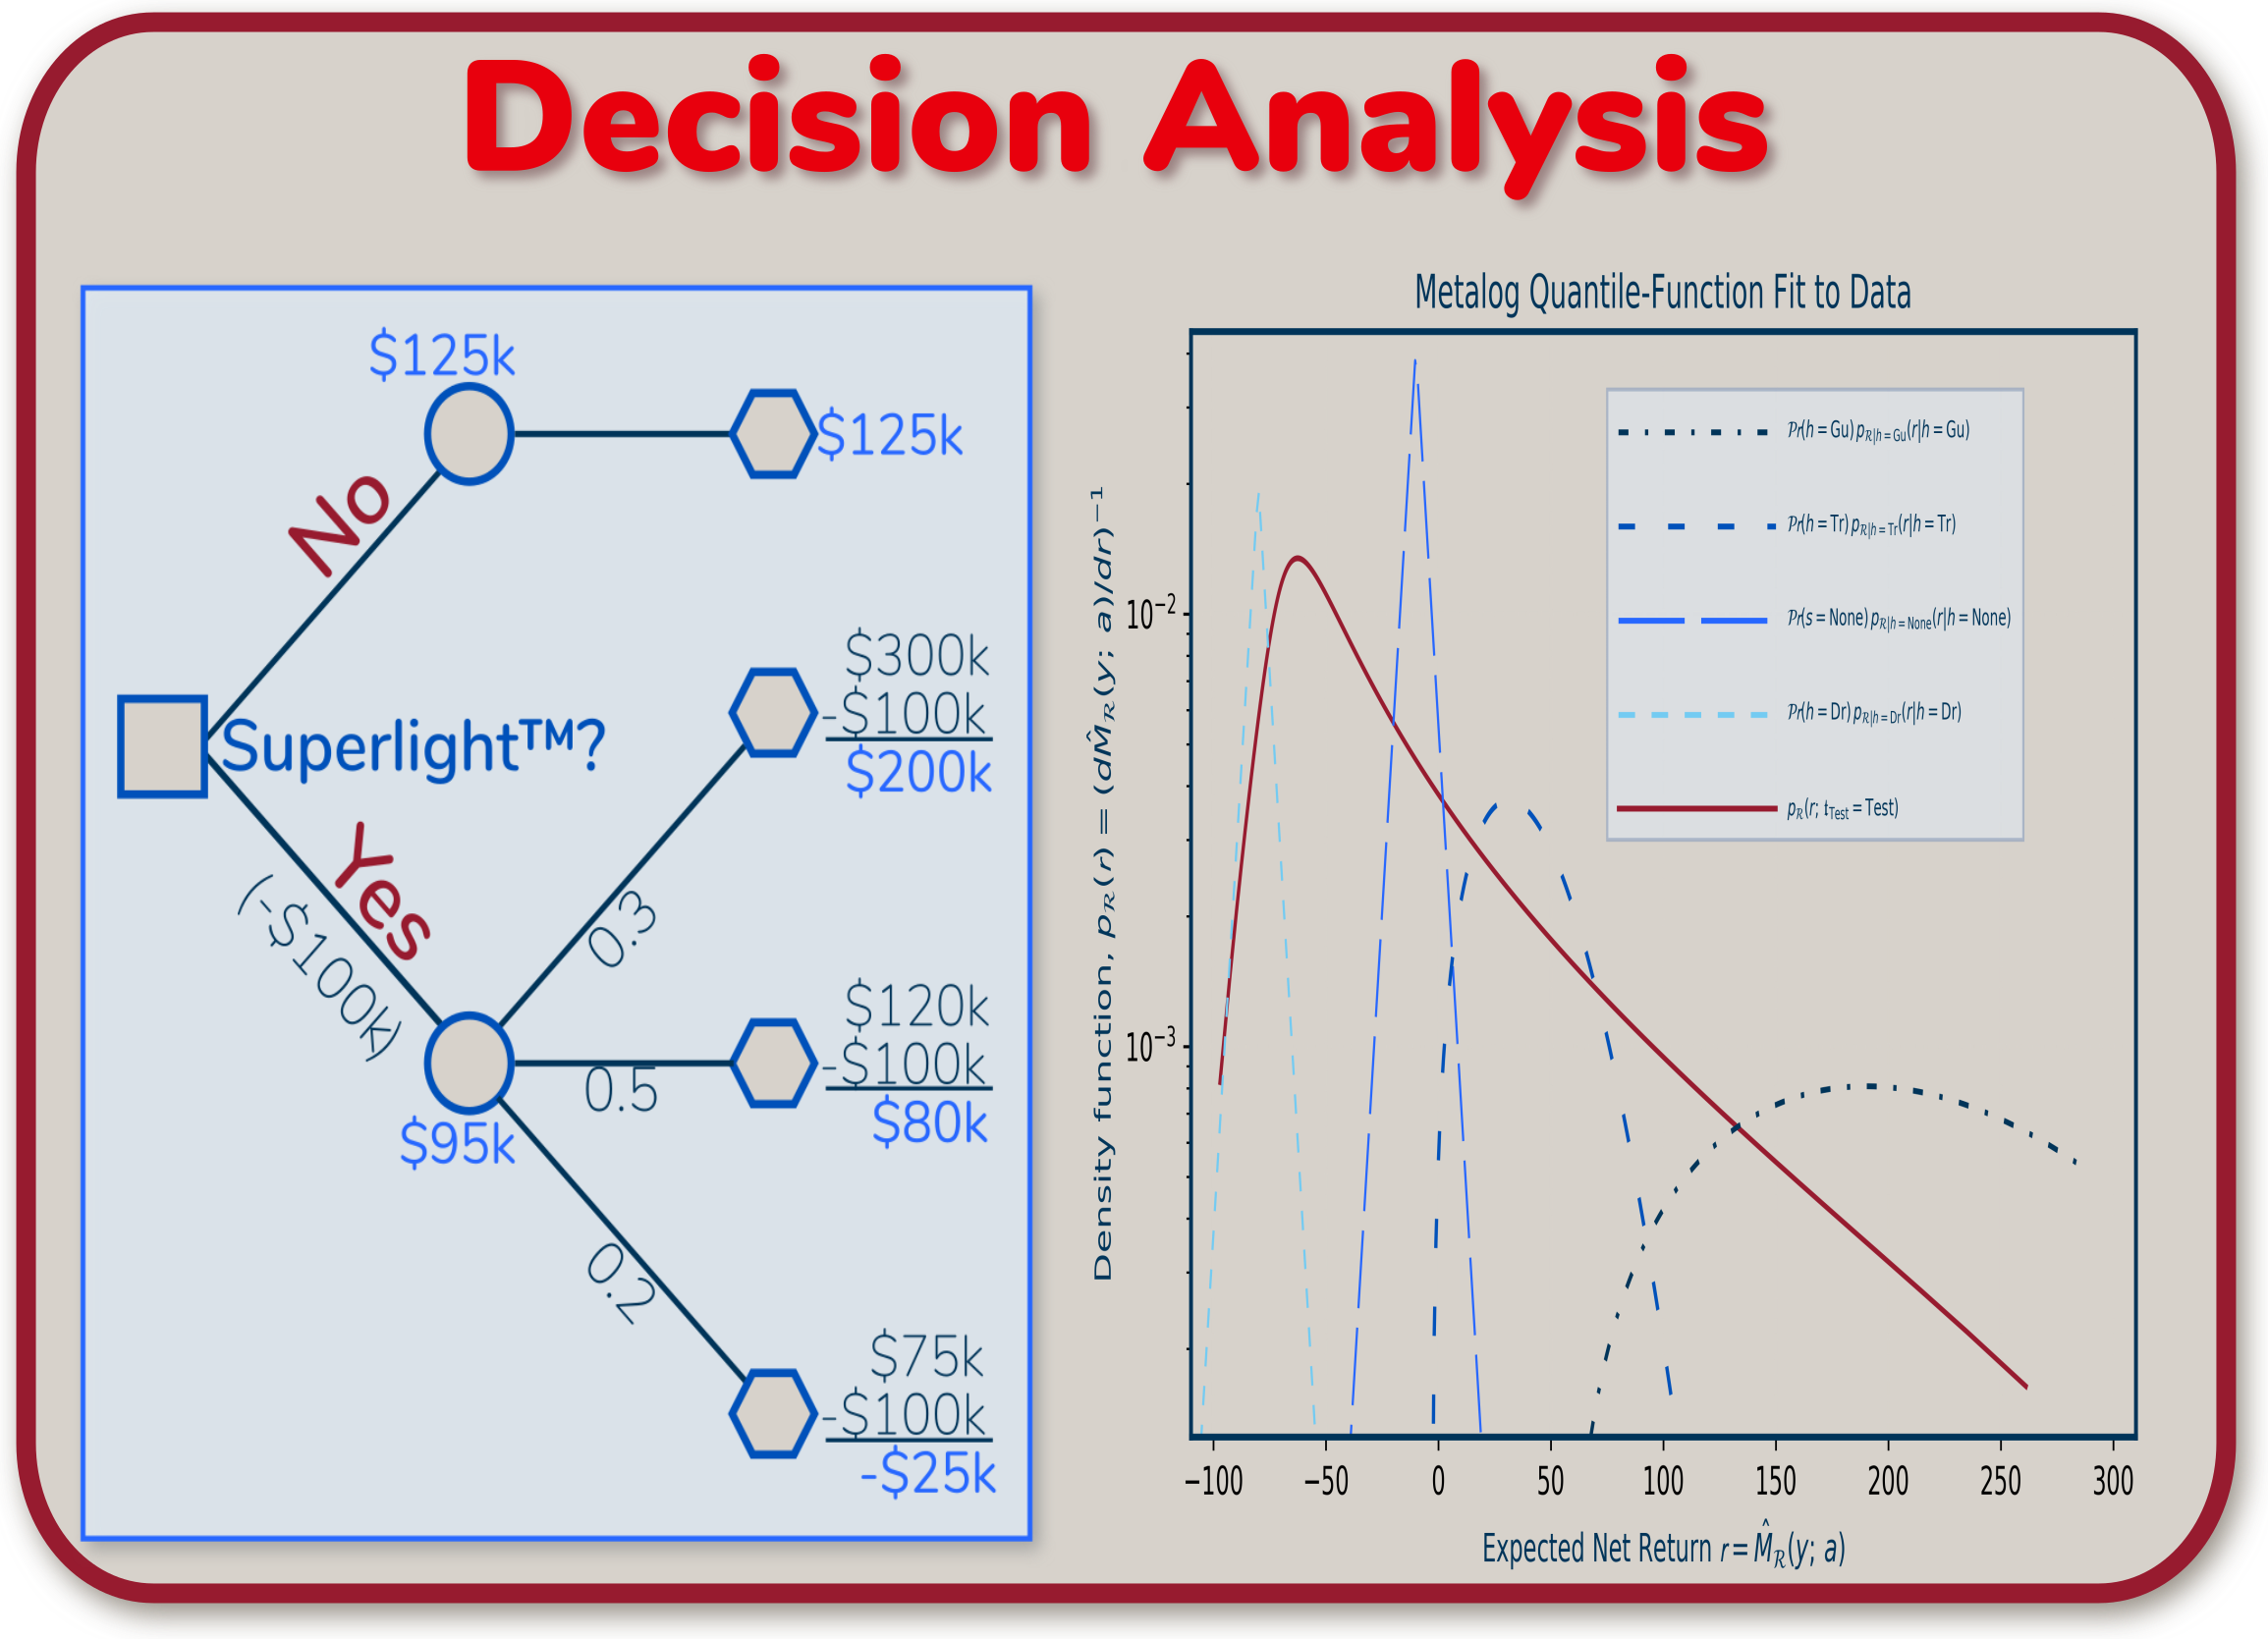
Managerial summary. Decision analysis and decision theory (aka decision science) are adjacent disciplines to data science. They frame decision-making, including data-science and machine-learning activities producing evidence on which to base decisions. Decision analysis in particular looks at the residual uncertainty from machine learning, and tries to attribute value to its reduction. Both disciplines — decision theory and data science — are deeply grounded in probability and statistics.
This work is an extension of the "Competitive advantage based on information" working paper. It goes deeper into the quantitative mechanics of attributing value to data-science and machine-learning results. For example, it might sometimes be necessary to consider trading off between accuracy and interpretability. Decision analysis provides formal, systematic methods for making these tradeoffs.
Technical summary (article abstract). Principles from Information Economics lead to a conjecture that three distinct modes exist for competitive differentiation based on information. Differentiated access affords informational asymmetries to competitors who enjoy it. Marketplace participants see in- formation in evidence that competitors miss through differentiated insights. Differentiated ability to act occurs in superior abilities to transform information into utility. This can be characterized by a formalism with Decision Analysis at its core. Other disciplines including theory of evidence, information theory, and competency-focused frameworks for differentiation also contribute. The theory of evidence produces a more-complete characterization of uncertainty than traditional Bayesian techniques. Information theory provides for a rigorous, abstract approach to quantifying information and uncertainty. Mining a textbook case study exercises the formalism to quantify returns from information, and to analogously corroborate our conjecture.
Publication. This work is undertaken with specific intent of publication in a peer-reviewed journal. It is believed orginal in that it combines a recent breakthrough from the Decision Analysis community with well-established methods from mathematical statistics. Derivative work products are targeted for four specific conferences during 2021. A proposal to the Symposium on Data Science and Statistics describes the heart of the work. Its principal utility — providing a bridge between data science and decision analysis — will be demonstrated first at Decision Analysis Affinity Group (DAAG) and Advances in Decision Analysis (ADA). The 89th Symposium by the Military Operations Resarch Society (MORS) on "Analytics to enhance decision making" represents another potential opportunity.
Managerial summary. All statistical- and machine-learning results are accompanied by irreducible error. Users of these results — managers making business-criticial decisions — often lack any sense whatsoever of the error from a machine-learning calculation.
Key concepts from the metrology community — specialists in the weights and measures for scientific, engineering, industrial, and commercial measurements — should be applied to machine learning as well. These concepts are: ⓵ "...measurements represent the only possible source of knowledge in the description of a particular feature or phenomenon of the physical world"; ⓶ "...any measurement result is capable of providing only incomplete information about the actual value of the measurand (i.e., the quantity being measured)"; and ⓷ "...a measurement result is informative if and only if it includes also an estimate of the incompleteness of this information" [S. Salicone, M. Prioli, 2018].
The field of staistics gives us approaches to estimate this irreducible error prior to attempting any modeling. These approaches are difficult to apply to non-ideal cases. Machine-learning practices do not therefore attempt to apply these techniques.
The Decision-Analysis commuity — practitioners of a discipline adjacent to data science — recently produced a novel technique to handling real-world, non-ideal data sets [Keelin, 2016]. This work combines this breakthrough with some of the traditional machinery from statistics. As a result, data scientists should be able to understand and describe what the best-achievable accuracy is given a particular data set.
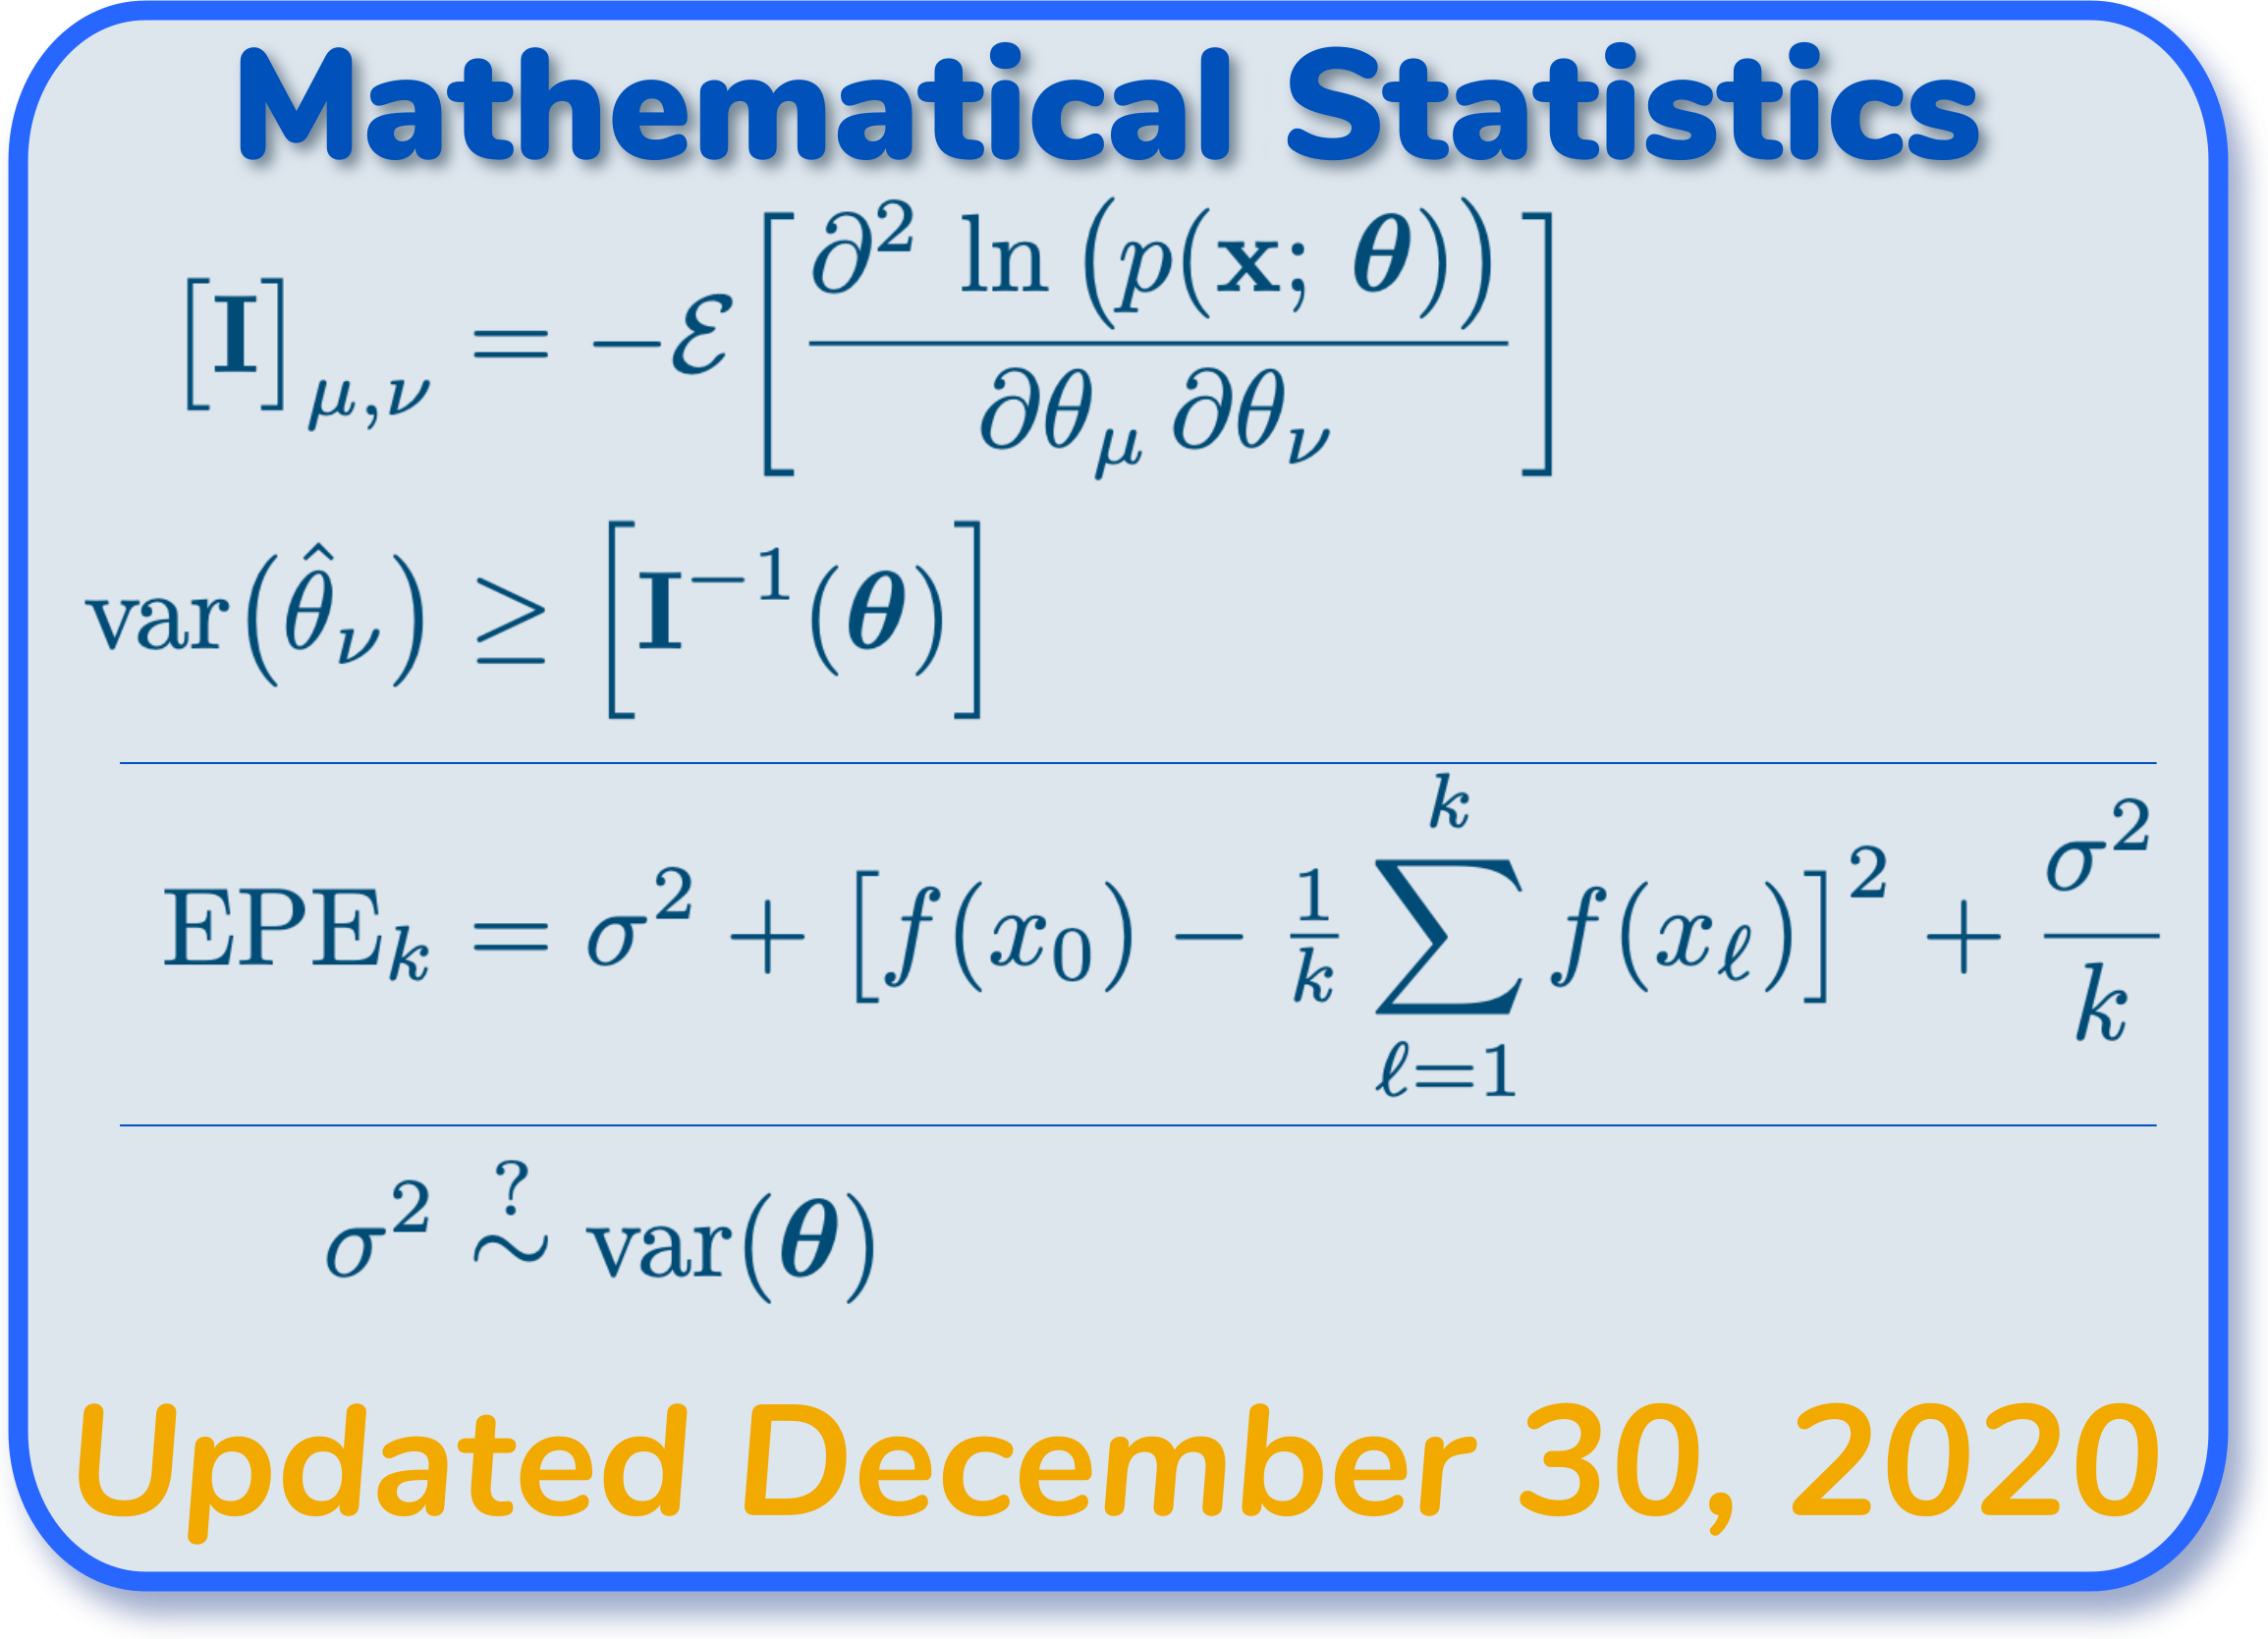
Technical summary. Data scientists spend lots of time thinking about the Bias-Variance Tradeoff (e.g., [Hastie, et al, 2009, §2.9]). Machine-learning practices emphasize bias and variance as they pertain to model-fitting. The formulation by Hastie, Tibshirani, Friedhman actually contains a third term, an "irreducible variance". Machine-learning practitioners generally pay less attention to this. Some writers even combine it with the bias term, effectively sweeping it under the rug. In contrast, many disciplines adjacent to data science apply particular emphasis understanding the irreducible-variance term [Kay, 1993].
The field of mathematical statistics (e.g., [Hogg, et al, 2013], [Kay, 1993]) gives us an explicit characterization of irreducible variance, the Cramer-Rao Lower Bound (CRLB). This bound is generally difficult to calculate for arbitrary probability distributions. Its use is therefore limited to idealized cases.
The decision-analysis community recently introduced a novel approach to fitting emprical probability distributions to infinitely-differentiable, continuous functions [Keelin, 2016]. This allows us to develop a CRLB for an arbitrary empirical probability distribution. Data scientists can thereby understand a priori what the irreducible variance of a data set is. This will support better-informed expectations about the best-achievable performance of a statistical model given a particular data set.